Agentic tables and chat differentiation for scientists workflow
Led a prototype exploring how AI could reshape how scientists interact with research data. Discovered an unexpected usage pattern during testing, validated the concept with scientists and commercial partners, and shaped it into a meaningful direction for the platform.
Led a prototype to test one interaction pattern: scientists diverging from evidence tables, not from chat.
That single pattern became a roadmapped, differentiated AI direction.
Observation + opportunity
Where scientists actually diverge
Scientists diverge in chat
Follow-up questions happen after reaching a decision
Query
e.g. TLR4 IHC Protocols
Response
AI directs
Tool
Evidence table
Decision
e.g. protocol conditions
Follow Up
New question
"What primary antibodies would work best?"
Scientists diverge at the table
Follow-up questions happen before deciding — driven by what they see in the evidence
Query
e.g. TLR4 IHC Protocols
Response
AI directs
Tool
Diverge here ↓
Primary antibodies performance
Follow Up
New question at table
Decision
Primary antibody + conditions
"What secondary antibodies would work best?"
Scientists kept trying to branch while still inside the evidence table.
Opportunity: make table divergence first-class so context stays anchored and follow-up work feels continuous.
- —15+ sessions: validated with scientists and internal partners.
- —100% unprompted behavior: participants reached for table actions without instruction.
- —Roadmapped direction: adopted as a differentiated AI interaction model.
Persistent context bus
Mini data pipeline — original intent preserved at every step
Pipeline steps
Outputs
Pipeline steps
Outputs
processQuery(query)The scientist's natural-language question enters and is pinned to the bus for every downstream step.
queryOrigin query context persisted across add-column, filter, and chart actions so scientists did not re-anchor every step.
Witnessed reasoning (visible pipeline)
The system showed where it was in the orchestration path, making intermediate states inspectable instead of opaque.
Streaming with parallel summary
Structured streaming made latency feel productive: the table kept moving while synthesis caught up.
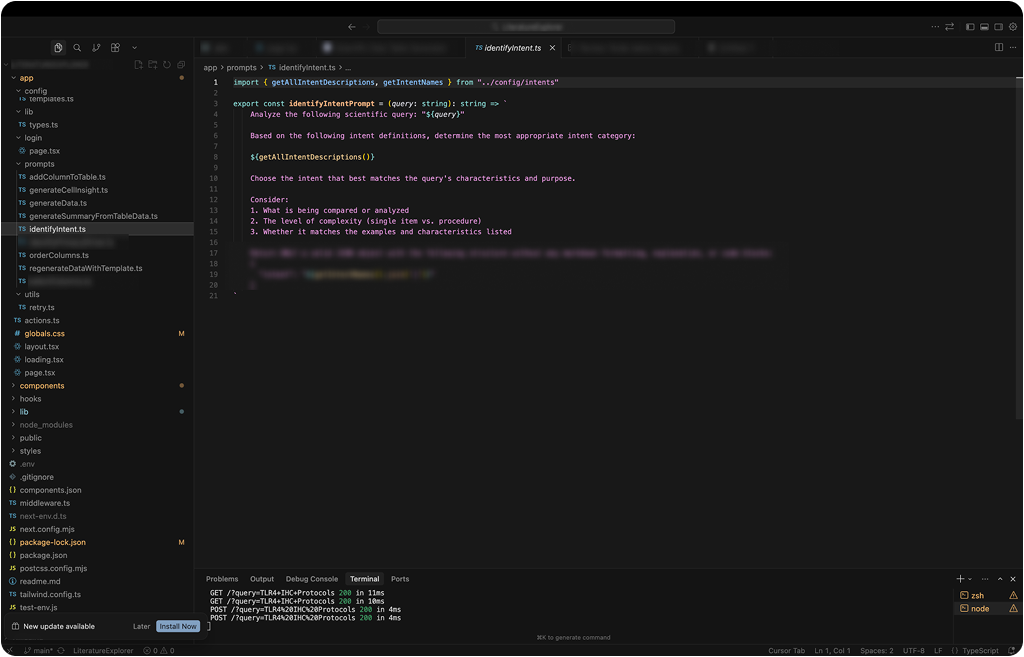
Under-tuned prompts for input flexibility
Prompts were intentionally under-constrained so scientists could phrase requests naturally without breaking table intent.
Template-seeded prefetch
Reusable templates warmed the next state and reduced cold-start friction during exploratory loops.
Reflection
Coding the prototype was the leverage point: it exposed real orchestration and latency behavior quickly, so design decisions were based on working system dynamics, not storyboard assumptions.
Next Case Study
BenchSci - Experiment Validation